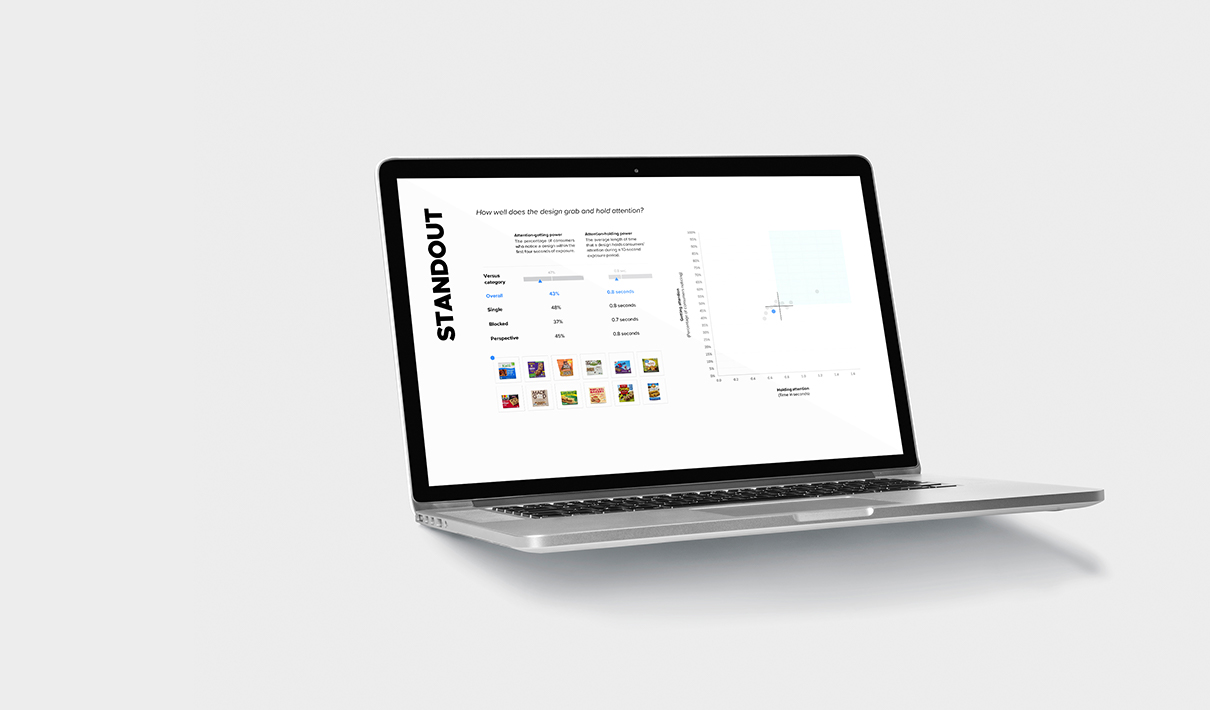
At Designalytics, we’ve transformed design testing by addressing long-standing issues with fresh, data-focused solutions—and that includes using cutting-edge technology to measure standout. Our system utilizes stimuli with fewer confounding variables and webcam eye-tracking technology that measures the direction and duration of a consumer’s gaze in remarkable detail.
And that’s just the beginning of the advantages. Here are some of the reasons Designalytics’ system is a much better way to measure standout:
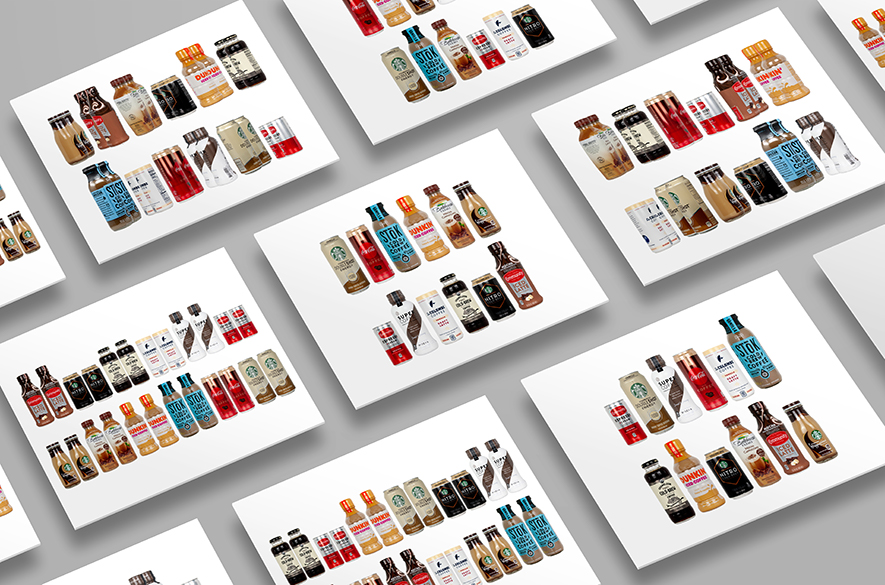
We measure dozens of retail scenarios vs. a single planogram
At Designalytics, we consider multiple scenarios that reflect real-world shopping experiences. We test up to 36 different retail configurations—not just a single planogram— and obsessively account for different product adjacencies and positioning. Every brand is seen in every position and adjacent to each competitor an equal number of times, which ensures we’re measuring the inherent efficacy of the design, rather than distortive factors over which brands have limited influence (shelf positioning, competitive adjacencies, etc.).
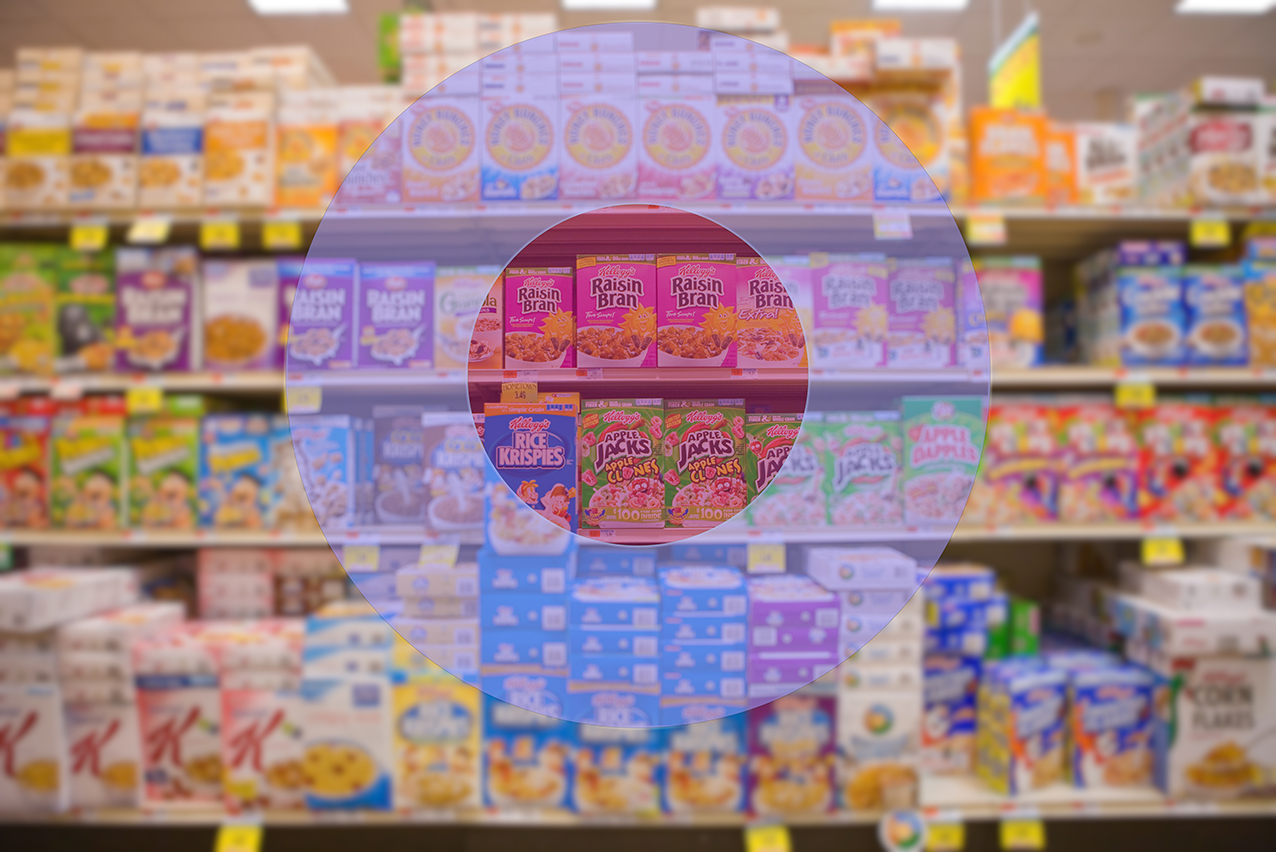
In most stores, consumers stand approximately three feet from the shelves they're perusing. Only a few brands can occupy their field of vision at a time—a reality not reflected in planogram-based testing.
We test in competitive contexts, while adhering to consumers’ realistic visual limitations
Planograms assume that shoppers can take in all products on a shelf at once—and that’s just in the context of physical retail stores, to say nothing of online shopping. Standing a few feet from the shelf in a typical store aisle, consumers only see a fraction of the brands included in a planogram at one time. Our research stimuli hew to the actual visual field of a consumer, presenting package designs in a format that is easily viewed and apprehended.
We represent key characteristics of both brick & mortar and e-commerce retail scenarios
It’s no longer just a brick-and-mortar world, and design testing needs to reflect that. Our approach tests a range of stimuli—including single-facing (e-commerce) and blocked-facing (brick-and-mortar) retail scenarios—that more accurately represents the continuum of shopping scenarios. In other words, we test for the many ways people actually experience packaging, not the way we wish they did.
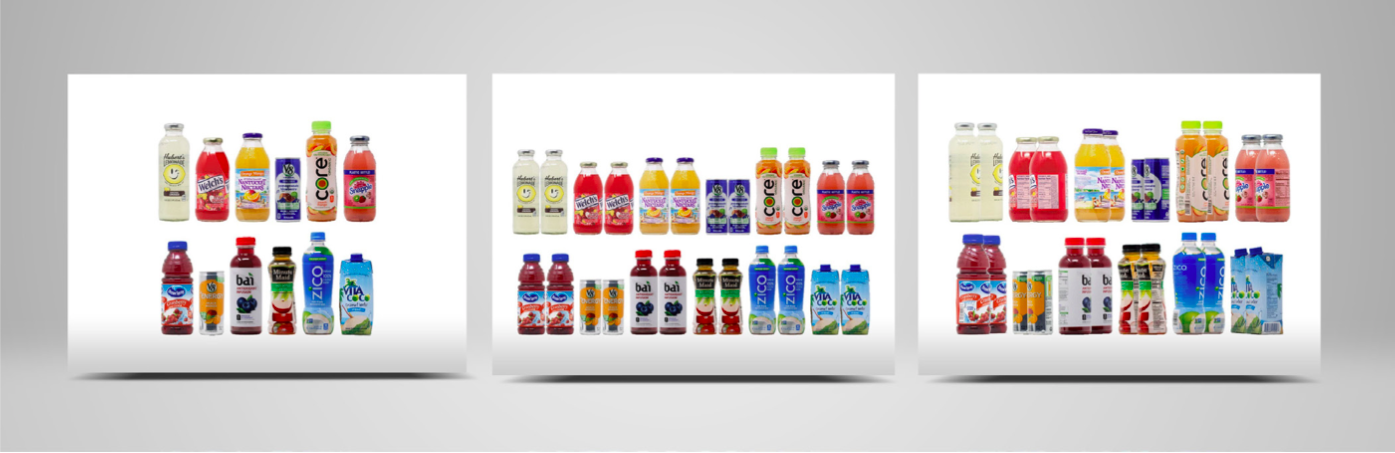
Designalytics evaluates designs in three scenarios (single-facing, blocked-facing, and at an angle).
We use realistic, consistent product stimuli for the most reliable data
Accurately reflecting the consumer experience requires additional effort in certain areas, such as stimulus development. Many researchers have heard the aphorism, “Garbage in, garbage out,” which describes the consequences of comparing flawed or unequal stimuli; the resultant data is useless. For example, a pristine, photo-realistic rendering of a package will surely possess an unrealistic advantage when compared to actual photographs of competitors’ products.
That’s why Designalytics offers full-service product procurement and photography—so that we can address eventualities like product-size differences and disparities in photographic quality due to inconsistent lighting and styling. This hands-on perspective allows us to minimize data distortions caused by variables not intrinsic to the designs themselves, and to reflect the retail reality as closely as possible.
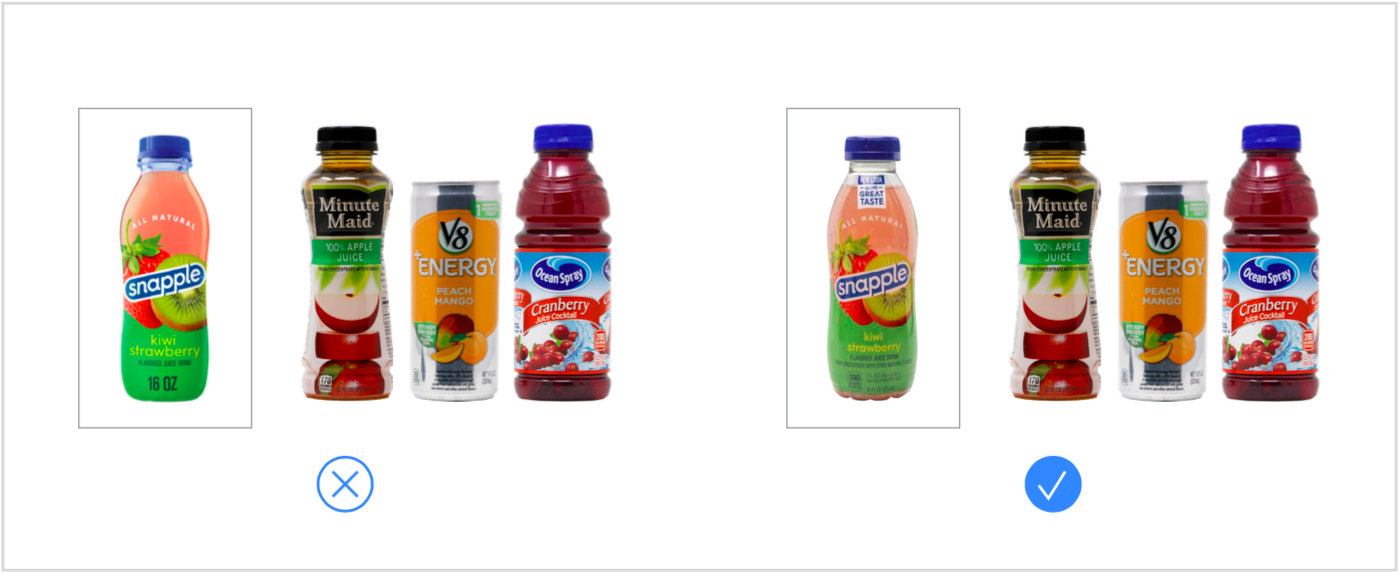
Inconsistencies in photo quality and styling can skew results when comparing two or more designs. For example, an idealized rendering (left) may test more positively than a real, photographed package that looks consistent with other brands in the competitive set (right). For this reason, Designalytics offers product procurement and photography services.