
In the consumer-packaged-goods world, it’s a widely held belief that planograms are the “gold standard” for measuring the effectiveness of a package design in a retail environment. This idealized depiction of store shelves is meant to showcase a brand’s packaging “in context”—reflecting what consumers see and, thus, providing insights into their behavior. There’s just one problem with this.
It doesn’t match up with reality. (And as problems go, that’s a pretty big one.)
In today’s marketplace, the reality is that there isn’t one “context”… and it’s possible there never really was. There have always been problems inherent in building a testing framework around an idealized and monolithic environment, and those problems have only multiplied in the world of e-commerce. In truth, planogram-based design testing is built around a series of myths–and busting them is long overdue. Here are a few of the most common misconceptions and their real-world counterparts.
Myth: A planogram encapsulates a realistic retail environment.
Reality: One planogram can scarcely represent one retail environment realistically, let alone thousands.
By presenting products on a “shelf,” the planogram model suggests that this is the way consumers will see these products no matter where they are. As anyone who has been shopping on a regular basis knows, nothing is as simple or uniform as that in real life.
In truth, stores can have wildly divergent configurations, with products in varying positions on the shelf, distinct left/right adjacencies, invasive merchandising, and private label competitors that are unique to each retailer. (Sidenote: Private label sales are on the upswing again after a disappointing 2020, as two-thirds of consumers have shifted their buying habits in recent months.)
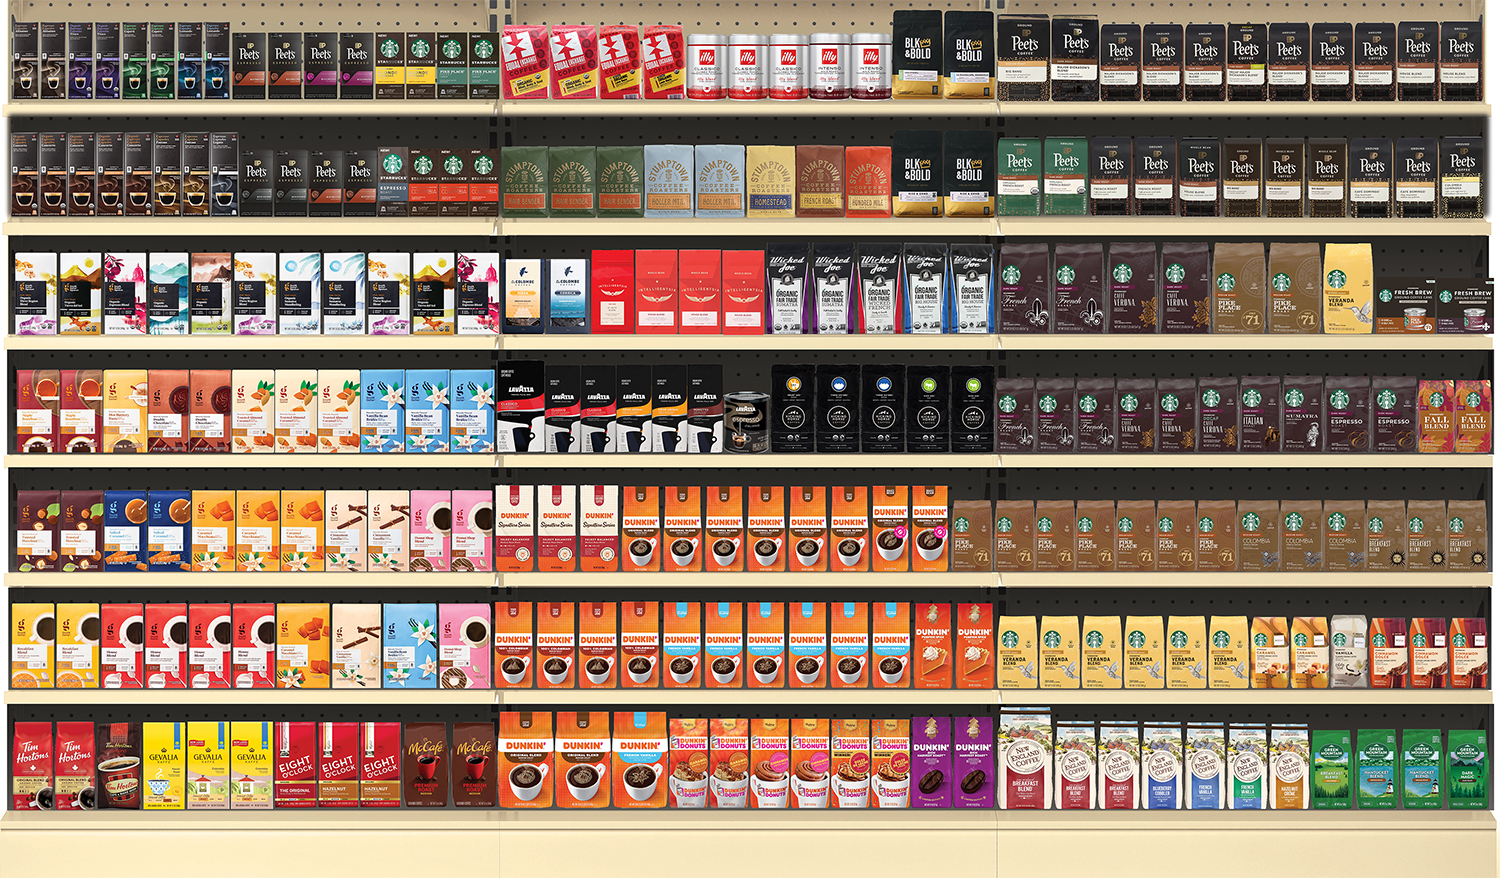
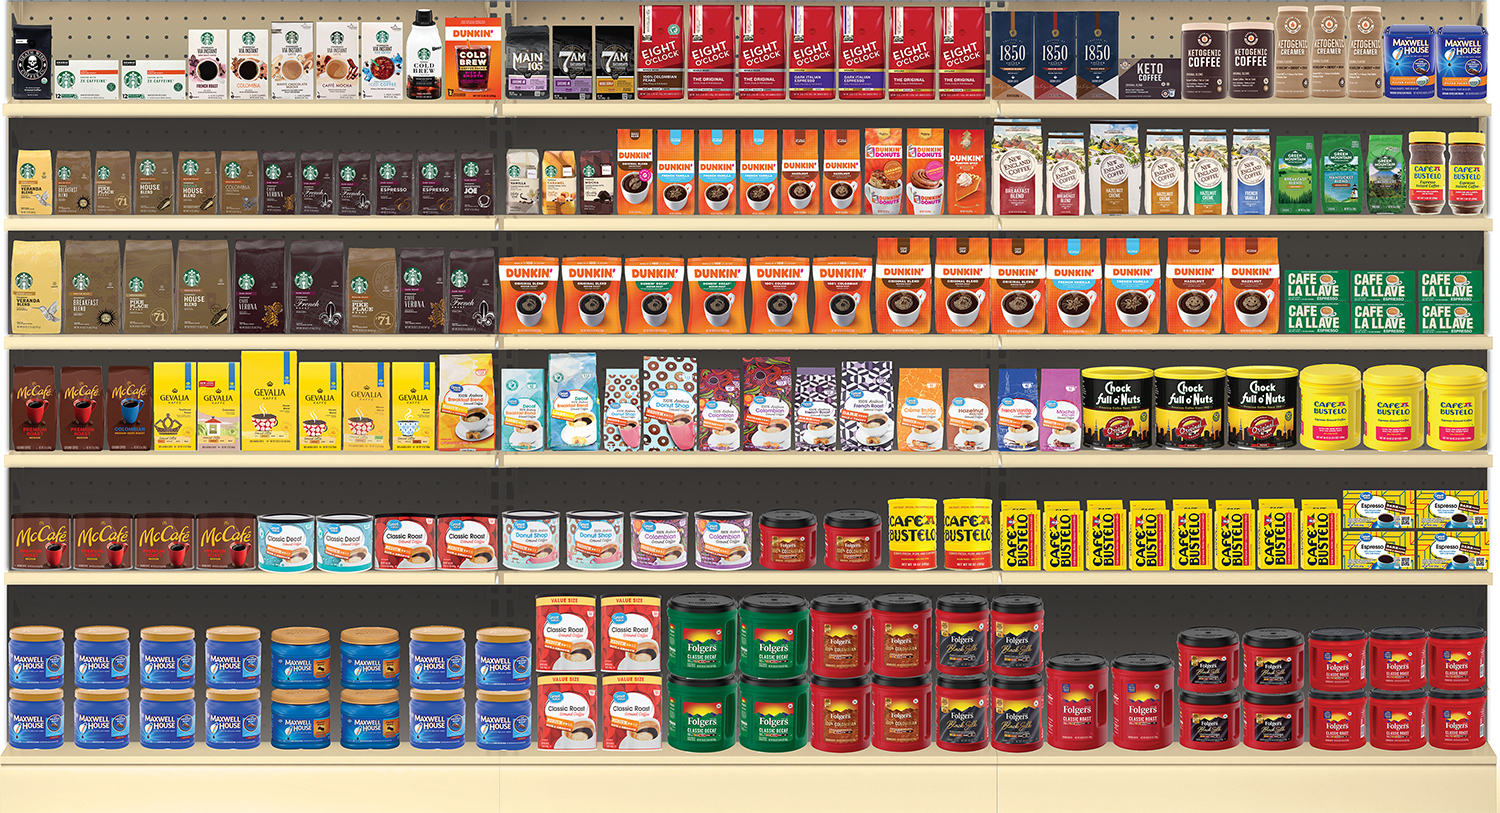
Even if the planogram is designed based on one of Walmart’s store layouts with some similarities across locations, common sense dictates that there are still major differences from store to store, and region to region. Even Target, another big-box mass merchant, will have a very different brand composition and layout for the same category. Plus, this completely ignores the reality in other retail environments, such as brick-and-mortar grocery, convenience, and drug stores (not to mention e-commerce–see below).
Myth: Planograms accurately represent consumers’ in-aisle experiences.
Reality: They reflect a “perfect world” that rarely, if ever, exists.
Imagine yourself in a typical grocery store aisle. Do you stand back to take in a view of an entire aisle of products at once? Of course not. In addition to the impossibility of taking in a 12-foot shelf span in a narrow aisle, this behavior would be wildly impractical. That’s simply not the way consumers shop.

Yet that’s exactly the scenario planograms present. The research stimulus assumes that shoppers can take in all products on a shelf at once, as if they are standing far away in an extremely wide aisle (and have borderline panoramic vision to boot). As it happens, a typical consumer will generally only stand 3-6 feet away from a shelf when viewing products.
Plus, there are other factors which poke a hole in this perfect-world façade, such as out-of-stock items, store merchandising, obstructive price stickers, and more.
Myth: Store shelves are the only natural setting for products.
Reality: Not anymore. E-commerce has no shelves.
The ascendancy of online shopping has brought planograms’ increasing obsolescence into sharp relief. E-commerce has rendered this approach quaintly antique, especially in the wake of the COVID-19 pandemic. In the first quarter of 2021, online sales were up 39% over last year and grocery shopping saw an intriguing shift as well. A recent study found that nearly 60 percent of Americans had shopped online for groceries in the past year and, importantly, virtually the same percentage planned to shop online as frequently or even more frequently.
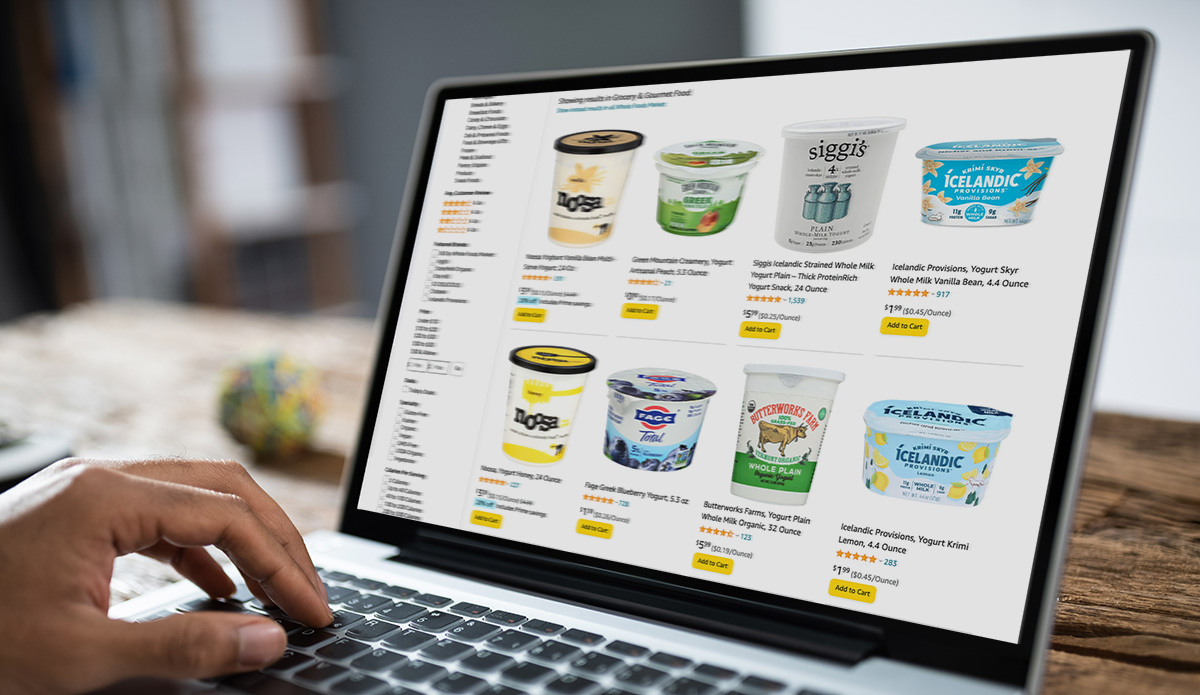
E-commerce is the great democratizer—each brand gets one “facing,” and the order of products is unpredictable. Planograms heavily weight factors that are irrelevant in the online marketplace (i.e., the number of facings) or over which brands have no control (where they appear on the website or app, which brands they’re next to, etc.).
At Designalytics, we test multiple scenarios that reflect real-world shopping experiences. We test dozens of different retail configurations and arrangements—not just a single planogram—and obsessively account for different adjacencies and positioning to filter out their distortive influence in the data.
In other words, we test for the many ways people actually experience packaging, not the way we wish they did.
Myth: Planogram-based design testing is the “gold standard” in the industry.
Reality: Standards change as realities do. The real “gold” is in getting reliable, actionable data.
“Remember that the six most expensive words in business are: ‘We’ve always done it that way.’”
That quote from Australian author and businessperson Catherine DeVrye highlights the danger of complacency and the need to constantly reevaluate your approach in business.
At Designalytics, we offer unprecedented data quality thanks to our massive sample sizes, advanced exercise design, and multi-view standout evaluation (rather than a single planogram). In addition to classic performance indicators, we’ve pioneered entirely new-to-industry metrics like distance recognition, memory structures, and distinctive assets, and we're also the only provider to ensure “first-view” data quality where each critical online activity utilizes a new set of consumers.
The result is a better and more comprehensive view upon which to base important design decisions. How do we know? Because we empirically validate our metrics with real business outcomes with astoundingly high predictive correlations.
Planograms have had their run—but then, so did VHS tapes (Blockbuster, we hardly knew ye) and landline phones. As times change, businesses need to adapt with them… or face the ramifications of accepting the status quo simply because that’s the way it’s always been done.